iostat – jest
narzędziem prezentującym wykorzystanie naszych urządzeń blokowych, czyli
w praktyce jest to monitorowanie pracy dysków twardych, tzw. I/O.
Saturacja dysków twardych jest zjawiskiem bardzo niepożądanym, które automatycznie przekłada się na zwolnienie pracy całego systemu, dzięki iostatowi, możemy szybko się przekonać czy przyczyna naszych problemów leży właśnie w za dużym wykorzystaniu zasobów I/O.
W wyniku widzimy dane dla naszego urządzenia ‚sda‚.
rrqm/s – ilość skolejkowanych żądań odczytu z dysku na sekundę
wrqm/s – ilość skolejkowanych żądań zapisu na dysk na sekundę
r/s – ilość odczytów z dysku na sekundę
w/s – ilość zapisów na dysk na sekundę
rsec/s – ilość sektorów czytanych na sekundę
wsec/s – ilość sektorów zapisywanych na sekundę
avgrq–sz – średni rozmiar w sektorach
avgqu–sz – średnia wielkość kolejki oczekujących żądań dostępu do dysku
await – średni czas dostępu do dysku (z uwzględnieniem kolejki) w milisekundach
svctm – średni czas obsługi żądania w milisekundach
%util – procentowe zużycie procesora potrzebne do obsłużenia żądania, jeśli wynosi 100% dochodzi do sytuacji saturacji zasobów
Jeśli wskazania iostata pokazują utylizację na poziomie 80-100% należy znaleźć przyczynę i ją wyeliminować, sytuacja ta oznacza, że nasz procesor spędza głównie czas w oczekiwaniu na dane a nie na ich przetwarzaniu.
Na jednym z serwerów zauważyłem dziwny wzrost obciążenia. Tzw. LOAD
od kilku dni po woli rósł. top pokazywał że dwa rdzenie CPU czekają na
dane z dysku – tzw. io wait na poziomie 80~90% ale żaden proces w
znaczącym stopniu nie obciążał CPU.
Jest kilka narzędzi (iostat, wmstat),
które pozwalają monitorować obciążenie dysków ale ja nie szukałem
informacji czy i w jakim stopniu dyski są obciążone – wiedziałem że są.
Chciałem dowiedzieć się który proces generuje to obciążenie – by móc go
ubić
Przydatny okazał się programik iotop – który działa jak top ale sortuje procesy w zależności od generowanego przez nie obciążenia dysków – właśnie tego szukałem:
Zrzut z programu iotop
Program jest w standardowych repozytoriach Debiana i można go zainstalować w ten sposób:
apt-get install iotop
TOP
TOP
VIRT - to co mysli ze mam, RES -> tyle ile faktycznie ma,
s-STAN np. z - zombie, przy CPU id-ile proces byl nieuzywany,
wa - io/wait po tym mozna sprawdzic czy nie potrzebujemy szybszego dysku,
hi -> przerwania
< > - sortowanie albo po lewej albo po prawej kolumnie,
R -> od najwiekszych do najmniejszych
1 -> pokazuje ilosc procesorow
NI - nice, priorytet. Dziala tak ze jak ktos ma wiekszy NICE to ma mniej procesora.
Zeby przyspieszyc np tylko jeden proces nalezy dac komus NIC ujemny.
r - zmieniamy NICE. Minusowe wartosci da sie robic tylko z konta roota.
k - killuje
load avarage -> jak obciazany jest system,
ilosc procesow ktore stoja w jakiejs kolejce do egzekucji.
Kazdy system moze inaczej, powyzej 1-ego juz wiadomo ze jest troche obciazony.
In addition
to re-scanning the entire bus, a specific device can be added or
existing device deleted using the following command: # echo 1 > /sys/block/devName/device/delete # echo 1 > /sys/block/sdc/device/delete
How Do I Add a Single Device Called /dev/sdc?
To add a single device explicitly, use the following syntax:
Create the file (touch>chmod>edit seems recommended, I don't known why): touch /etc/systemd/system/activefolder.service chmod 664 /etc/systemd/system/activefolder.service vim /etc/systemd/system/activefolder.service /etc/systemd/system/activefolder.service example: [Unit]
Description=activefolder After=network.target
[Service] WorkingDirectory=/var/www/activefolder/current ExecStart=/var/www/activefolder/current/script/delayed_job start Type=forking
PIDFile=/run/activefolder.pid Environment="RAILS_ENV=production" #User=httpd #Group=httpd [Install]
WantedBy=default.target
Then: systemctl daemon-reload systemctl start name.service
LUB
$ crontab -e

 Run a script called /home/vivek/bin/installnetkit.sh
 @reboot       /home/vivek/bin/installnetkit.sh
Start crond automatically at boot time
You also need to enable crond service via sys v / BSD init style system. Under RHEL / CentOS / Fedora, you need to use chkconfig (ntsysv) command to enable crond on boot: # chkconfig crond on ## Commands to start/stop/restart crond ### # service crond restart # service crond start # service crond stop
This
blog post explains how to share a VMDK between two virtual machines so
they can be clustered or any application that needs two machines to
share their disks.
Assume there are two VMs that participate in the clustering
Node-01 and Node-02
Create a Virtual disk on Node-01 that has to be shared with Node-02
Add a hard disk by clicking on Add a hardware and select Hard disk and click Next
Select Create a new virtual disk
Must be type Thick Provision Eager Zeroed !!!!!!!!!!!!!!!!!!
Choose SCSI (1:0) which creates a fresh SCSI controller apart from the
default one created during virtual machine creation and click Next
Click on Finish
Click on the newly created SCSI controller and change the SCSI Bus sharing option to “Physical”
Click on OK and power ON the machine
Now the newly added disk shows up on the Node-01 machine as /dev/sdb.
We need to add the Virtual disk created on Node-01 to Node-02
Click on Edit Setting of Node-02 machine and select Add hardware and click on hard disk
And click Next
Click on “use an existing virtual disk” and click Next
Browse to the location where Node-01’s VMDK file is present and select it
Confirm the path and click Next
Select SCSI (1:0) which creates a new SCSI controller on Node-02
Review the changes and click Finish
Select the newly created SCSI controller and select Physical under SCSI bus sharing option and click OK
Power on Node-02 and confirm that Node-01’s shared disk is showing up on Node-02
You might want to turn the Multi-writer flag in the advanced options of
VM so you can let the machines write to the disk. Follow the below link
for the same
Install HAProxy and Keepalived on both ubuntu nodes.
1
2
apt-getinstall haproxy
apt-getinstall keepalived
Load balancing in HAProxy also requires the ability to bind to an IP
address that are nonlocal, meaning that it is not assigned to a device
on the local system. Below configuration is added so that
floating/shared IP can be assigned to one of the load balancers. Below
line get it done.
1
net.ipv4.ip_nonlocal_bind=1
Now you know what’s happening with above lines let’s edit the sysctl.conf.
1
vim/etc/sysctl.conf
Add the below lines.
1
net.ipv4.ip_nonlocal_bind=1
To enable the changes made in sysctl.conf you will need to run the command.
root@S-09:~# sysctl -p
net.ipv4.ip_nonlocal_bind=1
vi /etc/defaults/haproxy CONFIG="/etc/haproxy/haproxy.cfg" ENABLED=1
Now let’s create keepalived.conf file on each instances. All the below Keepalived configurations are explained in the User guide provided by Keepalived and refer this guide as well.
#http-request add-header X-Forwarded-Proto https if { ssl_fc }
#option httpchk HEAD / HTTP/1.1\r\nHost:localhost
#cookie SERVERID insert indirect nocache
server web01 212.77.98.9:80 check #cookie s1
server web02 213.180.141.140:80 check #cookie s1
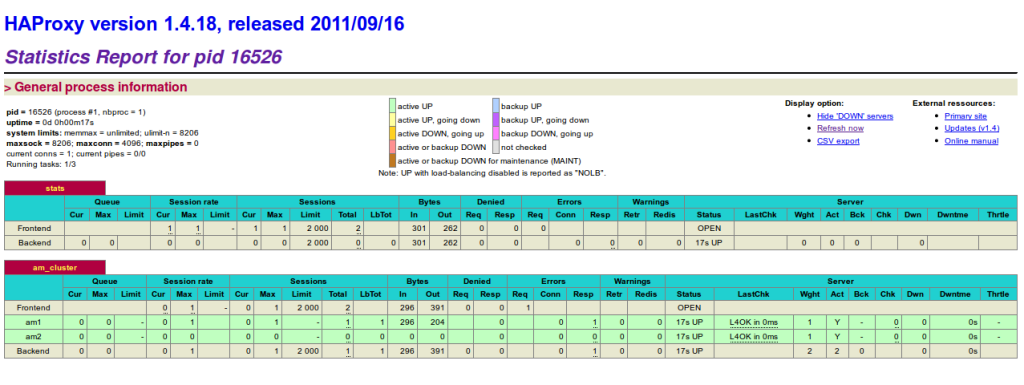
listen stats *:8989
stats enable
stats uri /
stats hide-version
stats auth admin:admin
# jeśli potrzebujesz proxy dla smtp
listen smtp :25
        mode tcp
        option tcplog
        balance roundrobin

        server smtp 192.168.0.1:25 check
        server smtp1 192.168.0.2:25 check
# jeśli potrzebujesz połączenie do RDP
listen rdp :3389
        mode tcp
        option tcplog
        balance rdp-cookie

        server sx01 10.1.1.11:3389 check
        server sx02 10.1.1.12:3389 check
If above configurations are not clear please refer this guide from HAProxy.
Testing
Let’s check whether our configuration has been done correctly. Try executing ip addr on master node. As you can see on the master node 192.168.6.164 IP is assigned.
1
2
3
4
5
6
7
8
9
10
11
12
root@S-08:~# ip addr
1:lo:<LOOPBACK,UP,LOWER_UP>mtu16436qdisc noqueue state UNKNOWN
2:eth0:<BROADCAST,MULTICAST,UP,LOWER_UP>mtu1500qdisc pfifo_fast state UP qlen1000
link/ether00:50:56:bb:05:08brd ff:ff:ff:ff:ff:ff
inet192.168.6.170/28brd192.168.6.175scope global eth0
inet6 fe80::250:56ff:febb:508/64scope link
valid_lft forever preferred_lft forever
Let stop the HAProxy on the master node. Now you can see that IP address 192.168.6.164 will be assigned to the salve node. If you start HAproxy instance on the master node IP address 192.168.6.164 will be assigned back to master node. See the O/P below.
Shell
1
2
3
4
5
6
7
8
9
10
11
root@S-08:~# ip addr
1:lo:<LOOPBACK,UP,LOWER_UP>mtu16436qdisc noqueue state UNKNOWN