sobota, 6 października 2012

NAGIOS - Bladecenter


Monitoring the IBM BladeCenter chassis with Nagios

Today I ended up working out the details on what we want to monitor regarding our BladeCenter. The most interesting details (for us that is) are these:
  • Fan speeds for Chassis Cooling/Power Module Cooling Bay(s)
  • Temperature
  • Power Domain utilization
It wasn’t *that* hard to implement. Only trouble(s) I ran into, were (1) IBM did a real shitty job with theMIB’s. If you look closely into the mmblade.mib, you’re gonna notice, that not a single OID is specified for the events. (2) As the MIB’s weren’t documented anywhere, I had to look them up via snmpwalk (which I had never used before). So as a reminder (to myself), here’s how it is done:
1
snmpwalk -v1 -c public -O n 10.0.0.35 .1.3.6.1.4.1.2.3.51.2.2
This will get you a list, with a lot of output (5154 lines to be exact). Lucky me, the web interface of the management module/ssh interface is rather verbose, so all you need to do is compare those values with what you are looking for.
So for myself (and anyone interested) read ahead for the list of checks we are currently running on the management module.
001
002
003
004
005
006
007
008
009
010
011
012
013
014
015
016
017
018
019
020
021
022
023
024
025
026
027
028
029
030
031
032
033
034
035
036
037
038
039
040
041
042
043
044
045
046
047
048
049
050
051
052
053
054
055
056
057
058
059
060
061
062
063
064
065
066
067
068
069
070
071
072
073
074
075
076
077
078
079
080
081
082
083
084
085
086
087
088
089
090
091
092
093
094
095
096
097
098
099
100
101
102
103
104
105
106
107
108
109
110
111
112
113
114
115
116
117
118
119
120
121
122
123
124
125
126
127
128
129
130
131
132
133
134
135
136
137
138
139
140
141
142
143
144
145
146
147
148
149
150
151
152
153
154
155
156
define command {
  command_name      check_snmpv1
  command_line      /usr/lib/nagios/plugins/check_snmp -C public \
                             -H $HOSTADDRESS$ -o $ARG1$ -w $ARG2$ \
                             -c $ARG3$ -l $ARG5$ -u $ARG4$
}
 
define host {
  use                   generic-network
  host_name             bc-mgmt1
  alias                 bc-mgmt1.home.barfoo.org
  address               10.0.0.35
  parents               uni-greif-05
}
 
define service {
  use                   generic-service
  host_name             bc-mgmt1
  service_description   Temperature
  check_command         check_snmpv1!.1.3.6.1.4.1.2.3.51.2.2.1.5.1.0!\
                                  33!38!C!Input temperature
  action_url            /pnp/index.php?host=$HOSTNAME$&srv=$SERVICEDESC$
  notes                 View PNP RRD grap
}
 
define service {
  use                   generic-service
  host_name             bc-mgmt1
  service_description   Chassis Cooling - Bay 1
  check_command         check_snmpv1!.1.3.6.1.4.1.2.3.51.2.2.3.20.0!\
                                  1600:1200,2100:2600!1200:0,2600:3000!RPM!\
                                  Chassis Cooling - Bay 1
  action_url            /pnp/index.php?host=$HOSTNAME$&srv=$SERVICEDESC$
  notes                 View PNP RRD grap
}
 
define service {
  use                   generic-service
  host_name             bc-mgmt1
  service_description   Chassis Cooling - Bay 2
  check_command         check_snmpv1!.1.3.6.1.4.1.2.3.51.2.2.3.21.0!\
                                  1600:1200,2100:2600!1200:0,2600:3000!RPM!\
                                  Chassis Cooling - Bay 2
  action_url            /pnp/index.php?host=$HOSTNAME$&srv=$SERVICEDESC$
  notes                 View PNP RRD grap
}
 
define service {
  use                   generic-service
  host_name             bc-mgmt1
  service_description   Power Module Cooling - Bay 1
  check_command         check_snmpv1!.1.3.6.1.4.1.2.3.51.2.2.6.1.1.6.1!\
                                  6200:5400,6700:7000!5300:0,7000:7500!RPM!\
                                  Power Module Cooling - Bay 1
  action_url            /pnp/index.php?host=$HOSTNAME$&srv=$SERVICEDESC$
  notes                 View PNP RRD grap
}
 
define service {
  use                   generic-service
  host_name             bc-mgmt1
  service_description   Power Module Cooling - Bay 1 Fans
  check_command         check_snmpv1!.1.3.6.1.4.1.2.3.51.2.2.6.1.1.4.1!\
                                  2:1!1:0!Fans present!\
                                  Power Module Cooling - Bay 1
  action_url            /pnp/index.php?host=$HOSTNAME$&srv=$SERVICEDESC$
  notes                 View PNP RRD grap
}
 
define service {
  use                   generic-service
  host_name             bc-mgmt1
  service_description   Power Module Cooling - Bay 2
  check_command         check_snmpv1!.1.3.6.1.4.1.2.3.51.2.2.6.1.1.6.2!\
                                  6200:5400,6700:7000!5300:0,7000:7500!RPM!\
                                  Power Module Cooling - Bay 2
  action_url            /pnp/index.php?host=$HOSTNAME$&srv=$SERVICEDESC$
  notes                 View PNP RRD grap
}
 
define service {
  use                   generic-service
  host_name             bc-mgmt1
  service_description   Power Module Cooling - Bay 2 Fans
  check_command         check_snmpv1!.1.3.6.1.4.1.2.3.51.2.2.6.1.1.4.2!\
                                  2:1!1:0!Fans present!\
                                  Power Module Cooling - Bay 2
  action_url            /pnp/index.php?host=$HOSTNAME$&srv=$SERVICEDESC$
  notes                 View PNP RRD grap
}
 
define service {
  use                   generic-service
  host_name             bc-mgmt1
  service_description   Power Module Cooling - Bay 3
  check_command         check_snmpv1!.1.3.6.1.4.1.2.3.51.2.2.6.1.1.6.3!\
                                  6200:5400,6700:7000!5300:0,7000:7500!RPM!\
                                  Power Module Cooling - Bay 3
  action_url            /pnp/index.php?host=$HOSTNAME$&srv=$SERVICEDESC$
  notes                 View PNP RRD grap
}
 
define service {
  use                   generic-service
  host_name             bc-mgmt1
  service_description   Power Module Cooling - Bay 3 Fans
  check_command         check_snmpv1!.1.3.6.1.4.1.2.3.51.2.2.6.1.1.4.3!\
                                  2:1!1:0!Fans present!\
                                  Power Module Cooling - Bay 3
  action_url            /pnp/index.php?host=$HOSTNAME$&srv=$SERVICEDESC$
  notes                 View PNP RRD grap
}
 
define service {
  use                   generic-service
  host_name             bc-mgmt1
  service_description   Power Module Cooling - Bay 4
  check_command         check_snmpv1!.1.3.6.1.4.1.2.3.51.2.2.6.1.1.6.2!\
                                  6200:5400,6700:7000!5300:0,7000:7500!RPM!\
                                  Power Module Cooling - Bay 4
  action_url            /pnp/index.php?host=$HOSTNAME$&srv=$SERVICEDESC$
  notes                 View PNP RRD grap
}
 
define service {
  use                   generic-service
  host_name             bc-mgmt1
  service_description   Power Module Cooling - Bay 4 Fans
  check_command         check_snmpv1!.1.3.6.1.4.1.2.3.51.2.2.6.1.1.4.2!\
                                  2:1!1:0!Fans present!\
                                  Power Module Cooling - Bay 4
  action_url            /pnp/index.php?host=$HOSTNAME$&srv=$SERVICEDESC$
  notes                 View PNP RRD grap
}
 
define service {
  use                   generic-service
  host_name             bc-mgmt1
  service_description   Power Domain 1: Utilization
  check_command         check_snmpv1!.1.3.6.1.4.1.2.3.51.2.2.10.1.1.1.10.1!\
                                  2600:2400!2880:2600!W!\
                                  Power Domain 1: Utilization
  action_url            /pnp/index.php?host=$HOSTNAME$&srv=$SERVICEDESC$
  notes                 View PNP RRD grap
}
 
define service {
  use                   generic-service
  host_name             bc-mgmt1
  service_description   Power Domain 2: Utilization
  check_command         check_snmpv1!.1.3.6.1.4.1.2.3.51.2.2.10.1.1.1.10.2!\
                                  2600:2400!2880:2600!W!\
                                  Power Domain 2: Utilization
  action_url            /pnp/index.php?host=$HOSTNAME$&srv=$SERVICEDESC$
  notes                 View PNP RRD grap
}

NAGIOS - DS4700

http://blog.hunkirchen.net/2009/12/14/nagios-check-ds4700-cabinet-and-hw/

NAGIOS - VMware ESXi


This article describes how to monitor a VMWare ESXi or vSphere host with Nagios, using the OP5 Check ESX Plugin written in PERL. The plugin can monitor either a single ESXi/vSphere server or a VirtualCenter/vCenter Server and individual virtual machines. We’ll see here how to monitor an ESXi 4 host.
The following tutorial has been made on a CentOS server, you may have to adapt some paths with other distributions.

Installation

The prerequisite for the plugin to work is to install the VMWare Perl SDK available on the manufacturer website.
Download the file on your server, for example in the root directory, untar it and run the installer that way :
# cd /root
# tar xvzf VMware-vSphere-Perl-SDK-4.1.0-254719.i386.tar.gz 
# cd vmware-vsphere-cli-distrib/
# ./vmware-install.pl
Follow the instructions given by the script. Depending on your setup, some PERL dependencies must be installed prior for the SDK to work correctly. When it’s done, we can get the plugin here, and copy it to/usr/lib/nagios/plugins/. Make it executable :
# cd /usr/lib/nagios/plugins/
# chmod a+x check_esx

Configuration

Now, we can start the real configuration for Nagios. We’ll need a username and password to access the ESXi host, let’s define those Nagios variables in a safe place in /etc/nagios/resource.cfg, so that this information will be hidden from the CGIs :
$USER11$=username
$USER12$=password
In this tutorial, we’ll be monitoring these resources : CPU, memory usage, net usage, runtime status and IO/read/write. But some more are available, see the references here. Below are the new commands related to ESXi to add in the /etc/nagios/objects/command.cfg file (these are the ESXi related commands only, NOT the full command.cfg, you may append this at the end of the file) :
# check vmware esxi machine
# check cpu
define command{
        command_name check_esx_cpu
        command_line $USER1$/check_esx -H $HOSTADDRESS$ -u $USER11$ -p $USER12$ -l cpu -s usage -w $ARG1$ -c $ARG2$
        }
 
# check memory usage
define command{
        command_name check_esx_mem
        command_line $USER1$/check_esx -H $HOSTADDRESS$ -u $USER11$ -p $USER12$ -l mem -s usage -w $ARG1$ -c $ARG2$
        }
 
# check net usage
define command{
        command_name check_esx_net
        command_line $USER1$/check_esx -H $HOSTADDRESS$ -u $USER11$ -p $USER12$ -l net -s usage -w $ARG1$ -c $ARG2$
        }
 
# check runtime status
define command{
        command_name check_esx_runtime
        command_line $USER1$/check_esx -H $HOSTADDRESS$ -u $USER11$ -p $USER12$ -l runtime -s status
        }
 
# check io read
define command{
        command_name check_esx_ioread
        command_line $USER1$/check_esx -H $HOSTADDRESS$ -u $USER11$ -p $USER12$ -l io -s read -w $ARG1$ -c $ARG2$
        }
 
# check io write
define command{
        command_name check_esx_iowrite
        command_line $USER1$/check_esx -H $HOSTADDRESS$ -u $USER11$ -p $USER12$ -l io -s write -w $ARG1$ -c $ARG2$
        }
And an example of the configuration for a Nagios host called esxi01 in /etc/nagios/hosts/esxi01.cfg :
# Host esx01
define host{
        use                     linux-server
        host_name               esxi01
        alias                   VMWare ESXi 01
        address                 192.168.1.100
        }
 
# Define a service to "ping" the local machine
define service{
        use                             generic-service
        host_name                       esxi01
        service_description             PING
        check_command                   check_ping!100.0,20%!500.0,60%
        }
 
# VMWare
# check cpu
define service{
        use                             generic-service
        host_name                       esxi01
        service_description             ESXi CPU Load
        check_command                   check_esx_cpu!80!90
        }
 
# check memory usage
define service{
        use                             generic-service
        host_name                       esxi01
        service_description             ESXi Memory usage
        check_command                   check_esx_mem!80!90
        }
 
# check net
define service{
        use                             generic-service
        host_name                       esxi01
        service_description             ESXi Network usage
        check_command                   check_esx_net!102400!204800
        }
 
# check runtime status
define service{
        use                             generic-service
        host_name                       esxi01
        service_description             ESXi Runtime status
        check_command                   check_esx_runtime
        }
 
# check io read
define service{
        use                             generic-service
        host_name                       esxi01
        service_description             ESXi IO read
        check_command                   check_esx_ioread!40!90
        }
 
# check io write
define service{
        use                             generic-service
        host_name                       esxi01
        service_description             ESXi IO write
        check_command                   check_esx_iowrite!40!90
        }
It’s done. Restart Nagios and wait a while (or re-schedule) for the new resources to be monitored.

NAGIOS - windows


I. Overview
II. 4 steps to install nagios on remote windows host
  1. Install NSClient++ on the remote windows server
  2. Modify the NSClient++ Service
  3. Modify the NSC.ini
  4. Start the NSClient++ Service
III. 6 configuration steps on nagios monitoring server
  1. Verify check_nt command and windows-server template
  2. Uncomment windows.cfg in /usr/local/nagios/etc/nagios.cfg
  3. Modify /usr/local/nagios/etc/objects/windows.cfg
  4. Define windows services that should be monitored.
  5. Enable Password Protection
  6. Verify Configuration and Restart Nagios.

I. Overview

.
Following three steps will happen on a very high level when Nagios (installed on the nagios-server) monitors a service (for e.g. disk space usage) on the remote Windows host.
  1. Nagios will execute check_nt command on nagios-server and request it to monitor disk usage on remote windows host.
  2. The check_nt on the nagios-server will contact the NSClient++ service on remote windows host and request it to execute the USEDDISKSPACE on the remote host.
  3. The results of the USEDDISKSPACE command will be returned back by NSClient++ daemon to the check_nt on nagios-server.

Following flow summarizes the above explanation:

Nagios Server (check_nt) —–> Remote host (NSClient++) —–> USEDDISKSPACE
Nagios Server (check_nt) <—– Remote host (NSClient++) <—– USEDDISKSPACE (returns disk space usage)

II. 4 steps to setup nagios on remote windows host

.

1. Install NSClient++ on the remote windows server

Download NSCP 0.3.1 (NSClient++-Win32-0.3.1.msi) from NSClient++ Project. NSClient++ is an open source windows service that allows performance metrics to be gathered by Nagios for windows services. Go through the following five NSClient++ installation steps to get the installation completed.

(1) NSClient++ Welcome Screen

(2) License Agreement Screen

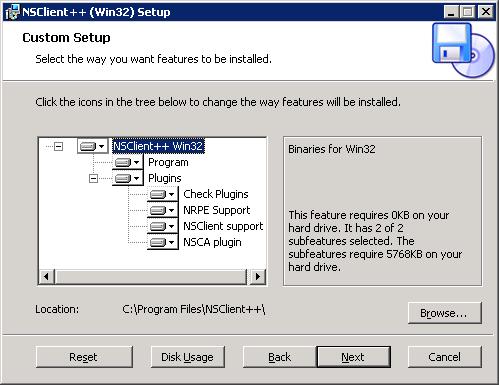
(3) Select Installation option and location. Use the default option and click next.

NSClient++ Install Screen

(4) Ready to Install Screen.  Click on Install to get it started.

(5) Installation completed Screen.

2. Modify the NSClient++ Service

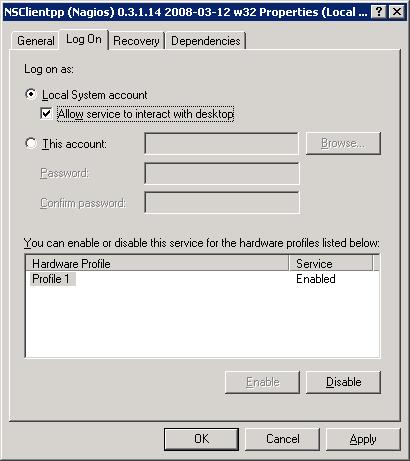
Go to Control Panel -> Administrative Tools -> Services. Double click on the “NSClientpp (Nagios) 0.3.1.14 2008-03-12 w32″ service and select the check-box that says “Allow service to interact with desktop” as shown below.
NSClient++ Service Modification


3. Modify the NSC.ini

(1) Modify NSC.ini and uncomment *.dll: Edit the C:\Program Files\NSClient++\NSC.ini file and uncomment everything under [modules] except RemoteConfiguration.dll and CheckWMI.dll
[modules]
;# NSCLIENT++ MODULES
;# A list with DLLs to load at startup.
;  You will need to enable some of these for NSClient++ to work.
; ! ! ! ! ! ! ! ! ! ! ! ! ! ! ! ! ! ! ! ! ! ! ! ! ! ! ! ! ! ! ! ! !
; *                                                               *
; * N O T I C E ! ! ! - Y O U   H A V E   T O   E D I T   T H I S *
; *                                                               *
; ! ! ! ! ! ! ! ! ! ! ! ! ! ! ! ! ! ! ! ! ! ! ! ! ! ! ! ! ! ! ! ! !
FileLogger.dll
CheckSystem.dll
CheckDisk.dll
NSClientListener.dll
NRPEListener.dll
SysTray.dll
CheckEventLog.dll
CheckHelpers.dll
;CheckWMI.dll
;
; RemoteConfiguration IS AN EXTREM EARLY IDEA SO DONT USE FOR PRODUCTION ENVIROMNEMTS!
;RemoteConfiguration.dll
; NSCA Agent is a new beta module use with care!
NSCAAgent.dll
; LUA script module used to write your own "check deamon" (sort of) early beta.
LUAScript.dll
; Script to check external scripts and/or internal aliases, early beta.
CheckExternalScripts.dll
; Check other hosts through NRPE extreme beta and probably a bit dangerous! :)
NRPEClient.dll

(2) Modify NSC.ini and uncomment allowed_hosts. Edit the C:\Program Files\NSClient++\NSC.ini file and Uncomment allowed_host under settings and add the ip-address of the nagios-server.
;# ALLOWED HOST ADDRESSES
;  This is a comma-delimited list of IP address of hosts that are allowed to talk to the all daemons.
;  If leave this blank anyone can access the deamon remotly (NSClient still requires a valid password).
;  The syntax is host or ip/mask so 192.168.0.0/24 will allow anyone on that subnet access
allowed_hosts=192.168.1.2/255.255.255.0
Note: allowed_host is located under [Settings], [NSClient] and [NRPE] section. Make sure to change allowed_host under [Settings] for this purpose.

(3) Modify NSC.ini and uncomment port. Edit the C:\Program Files\NSClient++\NSC.ini file and uncomment the port# under [NSClient] section
;# NSCLIENT PORT NUMBER
;  This is the port the NSClientListener.dll will listen to.
port=12489

(4) Modify NSC.ini and specify password. You can also specify a password the nagios server needs to use to remotely access the NSClient++ agent.
[Settings]
;# OBFUSCATED PASSWORD
;  This is the same as the password option but here you can store the password in an obfuscated manner.
;  *NOTICE* obfuscation is *NOT* the same as encryption, someone with access to this file can still figure out the
;  password. Its just a bit harder to do it at first glance.
;obfuscated_password=Jw0KAUUdXlAAUwASDAAB
;
;# PASSWORD
;  This is the password (-s) that is required to access NSClient remotely. If you leave this blank everyone will be able to access the daemon remotly.
password=My2Secure$Password

4. Start the NSClient++ Service

Start the NSClient++ service either from the Control Panel -> Administrative tools -> Services -> Select “NSClientpp (Nagios) 0.3.1.14 2008-03-12 w32″ and click on start (or) Click on “Start -> All Programs -> NSClient++ -> Start NSClient++ (Win32) . Please note that this will start the NSClient++ as a windows service.

Later if you modify anything in the NSC.ini file, you should restart the “NSClientpp (Nagios) 0.3.1.14 2008-03-12 w32″ from the windows service.

III. 6 configuration steps on nagios monitoring server

.

1. Verify check_nt command and windows-server template

Verify that the check_nt is enabled under /usr/local/nagios/etc/objects/commands.cfg
# 'check_nt' command definition
define command{
command_name    check_nt
command_line    $USER1$/check_nt -H $HOSTADDRESS$ -p 12489 -v $ARG1$ $ARG2$
}

Verify that the windows-server template is enabled under /usr/local/nagios/etc/objects/templates.cfg
# Windows host definition template - This is NOT a real host, just a template!
define host{
name                    windows-server  ; The name of this host template
use                     generic-host    ; Inherit default values from the generic-host template
check_period            24x7            ; By default, Windows servers are monitored round the clock
check_interval          5               ; Actively check the server every 5 minutes
retry_interval          1               ; Schedule host check retries at 1 minute intervals
max_check_attempts      10              ; Check each server 10 times (max)
check_command           check-host-alive        ; Default command to check if servers are "alive"
notification_period     24x7            ; Send notification out at any time - day or night
notification_interval   30              ; Resend notifications every 30 minutes
notification_options    d,r             ; Only send notifications for specific host states
contact_groups          admins          ; Notifications get sent to the admins by default
hostgroups              windows-servers ; Host groups that Windows servers should be a member of
register                0               ; DONT REGISTER THIS - ITS JUST A TEMPLATE
}

2. Uncomment windows.cfg in /usr/local/nagios/etc/nagios.cfg

# Definitions for monitoring a Windows machine
cfg_file=/usr/local/nagios/etc/objects/windows.cfg

3. Modify /usr/local/nagios/etc/objects/windows.cfg

By default a sample host definition for a windows server is given under windows.cfg, modify this to reflect the appropriate windows server that needs to be monitored through nagios.
# Define a host for the Windows machine we'll be monitoring
# Change the host_name, alias, and address to fit your situation

define host{
use             windows-server              ; Inherit default values from a template
host_name   remote-windows-host      ; The name we're giving to this host
alias            Remote Windows Host     ; A longer name associated with the host
address       192.168.1.4                   ; IP address of the remote windows host
}

4. Define windows services that should be monitored.

Following are the default windows services that are already enabled in the sample windows.cfg. Make sure to update the host_name on these services to reflect the host_name defined in the above step.
define service{
use                     generic-service
host_name               remote-windows-host
service_description     NSClient++ Version
check_command           check_nt!CLIENTVERSION
}
define service{
use                     generic-service
host_name               remote-windows-host
service_description     Uptime
check_command           check_nt!UPTIME
}
define service{
use                     generic-service
host_name               remote-windows-host
service_description     CPU Load
check_command           check_nt!CPULOAD!-l 5,80,90
}
define service{
use                     generic-service
host_name               remote-windows-host
service_description     Memory Usage
check_command           check_nt!MEMUSE!-w 80 -c 90
}
define service{
use                     generic-service
host_name               remote-windows-host
service_description     C:\ Drive Space
check_command           check_nt!USEDDISKSPACE!-l c -w 80 -c 90
}
define service{
use                     generic-service
host_name               remote-windows-host
service_description     W3SVC
check_command           check_nt!SERVICESTATE!-d SHOWALL -l W3SVC
}
define service{
use                     generic-service
host_name               remote-windows-host
service_description     Explorer
check_command           check_nt!PROCSTATE!-d SHOWALL -l Explorer.exe
}

5. Enable Password Protection

If you specified a password in the NSC.ini file of the NSClient++ configuration file on the Windows machine, you’ll need to modify the check_nt command definition to include the password. Modify the /usr/local/nagios/etc/commands.cfg file and add password as shown below.
define command{
command_name check_nt
command_line $USER1$/check_nt -H $HOSTADDRESS$ -p 12489 -s My2Secure$Password -v $ARG1$ $ARG2$
}

6. Verify Configuration and Restart Nagios.

Verify the nagios configuration files as shown below.
[nagios-server]# /usr/local/nagios/bin/nagios -v /usr/local/nagios/etc/nagios.cfg

Total Warnings: 0
Total Errors:   0

Things look okay - No serious problems were detected during the pre-flight check

Restart nagios as shown below.
[nagios-server]# /etc/rc.d/init.d/nagios stop
Stopping nagios: .done.

[nagios-server]# /etc/rc.d/init.d/nagios start
Starting nagios: done.

Verify the status of the various services running on the remote windows host from the Nagios web UI (http://nagios-server/nagios) as shown below.